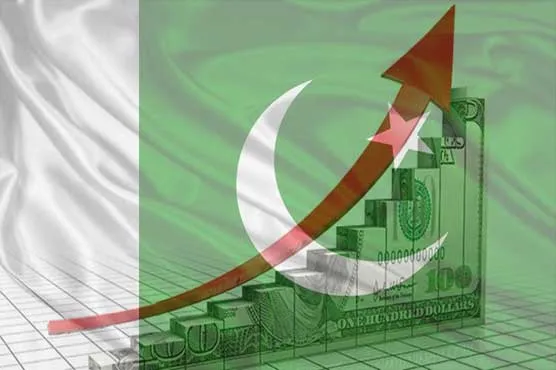
Pakistan’s weekly inflation increased by 0.57%, pushing the annual inflation rate to 11.97%, as prices of essential food items and household fuels continued to put pressure on consumers, according to the Pakistan Bureau of Statistics (PBS).
The latest weekly report showed that prices of 20 essential commodities increased, six declined and 25 remained unchanged during the reporting period. Wheat flour, chicken and gram pulse recorded some of the most notable weekly increases.
Wheat Flour, Chicken and Pulses Become More Expensive
Wheat flour prices rose by 5.69% over the week, while chicken became 4.93% more expensive. Gram pulse prices increased by 4%, and tomatoes recorded a 2.40% rise.
Prices of red lentils, black gram and tea also increased during the week. Petrol and liquefied petroleum gas (LPG) were among the other items that became more expensive.
These changes affect household budgets differently depending on consumption patterns, but increases in commonly purchased food items can add pressure to routine grocery spending.
Onion Prices Double Over the Year

The PBS figures also highlighted substantial year-on-year increases in several essential commodities.
Onion prices rose by 100%, meaning they were twice their level a year earlier. Wheat flour prices increased by 33%, while red chilli prices climbed by 15.55%.
Other food items also recorded annual increases:
- Beef: 12.6%
- Chicken: 9.44%
- Bread: 9%
- Yoghurt: 8%
The figures show that consumers continue to face higher prices for several everyday food products compared with the same period last year.
LPG, Electricity and Fuel Costs Record Sharp Annual Increases
Household energy and transport-related costs recorded some of the largest year-on-year increases in the PBS report.
LPG prices rose by 68%, while electricity charges increased by more than 58%. Petrol prices climbed by 47.52%, and diesel became 42.52% more expensive over the year.
These increases are important for household budgets because energy and fuel costs can affect both direct spending and the cost of transporting goods and providing services.
However, the weekly inflation figures alone do not establish how much each category contributed to the overall change in the inflation rate.
What the Latest Inflation Figures Mean for Households
The increase in weekly inflation indicates that prices across a number of essential categories moved higher during the reporting period. At the same time, the annual figures show that several food, energy and fuel prices remain substantially above their levels a year earlier.
For households, the practical effect depends on income, location and spending patterns. Families that devote a large share of their budgets to food, electricity and transport may feel these price increases more directly.
The PBS report provides a snapshot of price movements rather than a complete measure of every household’s living costs. The next weekly release will help show whether the latest increases persist or begin to ease.
For accurate interpretation, the reporting week and the relevant PBS inflation measure should be stated alongside the figures, since weekly inflation and year-on-year inflation measure different periods.
